Hi,
I have prepared an example demonstrating such kind of Liquid Chart component. The example project is found in the ZIP file:
https://ask.embedded-wizard.de/?qa=blob&qa_blobid=8991690050047055811
First at all, actually Embedded Wizard does not yet provide functionality to simply draw complex vector graphic. We have thus to use some tricks with several bitmaps overlayed one above the other. Following are the bitmaps I have quickly designed for this component with a graphic editor:
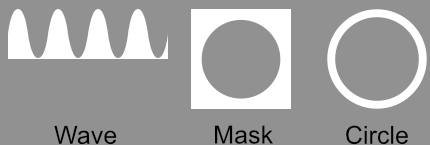
The bitmap Wave contains the form of the wave. To change the amplitude and the frequency of the wave, the bitmap will be simply stretched. To ensure, that only the circular part of the wave is visibly the bitmap is overlayed by a second bitmap Mask. Finally the bitmap Circle above the other both displays the ring around the wave form. All bitmaps are filled with white color only. This permits me later to use them as so-called ALPHA-ONLY bitmap. These can be colorized later at the runtime.
The example project contains the implementation of the GUI component LiquidChart. This component consists of 3 Image views to display the various bitmaps. Especially the Image view for the Wave bitmap is configured to stretch its content.
The component implements three properties Amplitude, Distance and Color. As the name indicates, the property Color determines the color to display the component (to colorize the bitmaps and text). The other properties determine the appearance of the wave form. Changing Amplitude affects the height of the wave. Changing Distance affects the frequency of the waves. The both properties are valid in range 0 .. 100.
The essential part of the component is implemented in the method UpdateViewState(). This method calculates from the properties Amplitude and Distance the size of the Image view where the Wave bitmap is shown. In this manner the Wave bitmap is stretched or scaled down. Furthermore, the component contains an animation effect which triggers the UpdateViewState() method periodically. With the value of the animation effect the Image view where the Wave bitmap is shown is scrolled.
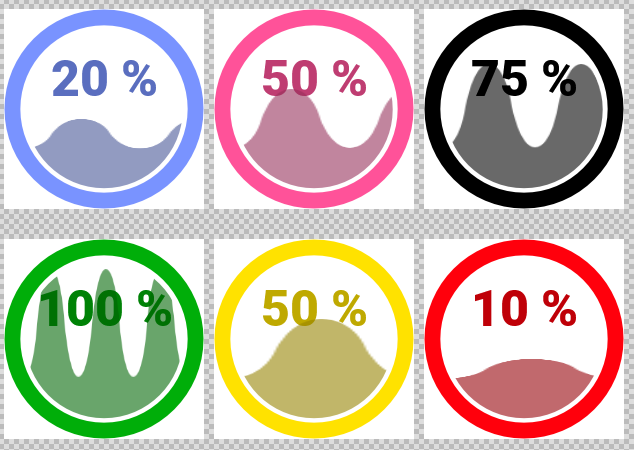
The other component Application found in the project demonstrates how several instances of the LiquidChart component are used. Every instance is configured with different values for the Amplitude and Distance as well as Color properties. When you start the Prototyper with the keys Ctrl+F5 the application appears with all the embedded LiquidChart component instances:
I hope, this example helps you to understand the trick how to develop such components and generally how to design components with Embedded Wizard.
Best regards
Paul Banach