984 views
in System Integration by

Hello EW Team,

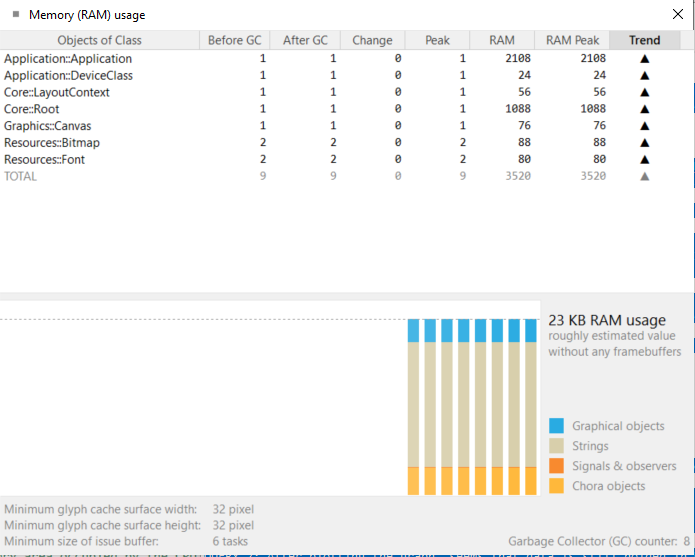
I am working on plotting graph with data received every 50ms from another device (iMXRT1060) using Device Object. I have checked the RAM usage (PFA image).
OBSERVATION 1: Graph is successfully plotted for first 6 tests. While executing 7th time, EwProcess() is not getting executed. Regarding Memory Allocation:

#define EW_FRAME_BUFFER_ADDR  DisplayInfo.FrameBuffer
#define EW_FRAME_BUFFER_SIZE  EW_FRAME_BUFFER_WIDTH * EW_FRAME_BUFFER_HEIGHT * EW_FRAME_BUFFER_DEPTH    //480*272*2 = 261,120
#define EW_DOUBLE_BUFFER_SIZE  EW_FRAME_BUFFER_SIZE        //480*272*2 = 261,120
#define EW_MEMORY_POOL_ADDR      DisplayInfo.MemoryPool
#define EW_MEMORY_POOL_SIZE      EW_FRAME_BUFFER_SIZE +  EW_FRAME_BUFFER_SIZE //480*272*2*2 

aDisplayInfo->FrameBuffer    = (void*)os_mem_alloc(EW_FRAME_BUFFER_SIZE);    // EW_FRAME_BUFFER_ADDR;
aDisplayInfo->DoubleBuffer   = (void*)os_mem_alloc(EW_DOUBLE_BUFFER_SIZE);    // EW_DOUBLE_BUFFER_ADDR;
aDisplayInfo->MemoryPool    = (void*)os_mem_alloc(EW_MEMORY_POOL_SIZE);    // EW_MEMORY_POOL_SIZE;

OBSERVATION 2: Graph is successfully plotted for first 13 tests. While executing 14th time, EwProcess() is not getting executed. Regarding Memory Allocation, only change is in Memory Pool Size:

#define EW_MEMORY_POOL_SIZE      EW_FRAME_BUFFER_SIZE +  EW_FRAME_BUFFER_SIZE +  EW_FRAME_BUFFER_SIZE //480*272*2*3

QUERY 1: How shall I check the Memory usage? As soon as I add

#ifdef EW_PRINT_MEMORY_USAGE
    EwPrintProfilerStatistic( 1 );
#endif

in my code, EwProcess() doesn't execute at all. However, I get the following in my Serial Logs, for first observation.

220909 12:56:35.38 GuiThread      OS_mem_alloc   : Alloc Size = 261120, 0x3fc00, at address 0x807da6e0
220909 12:56:35.38 GuiThread      OS_mem_alloc   : Alloc Size = 261120, 0x3fc00, at address 0x8081a300
220909 12:56:35.38 GuiThread      OS_mem_alloc   : Alloc Size = 522240, 0x7f800, at address 0x80859f20

QUERY 2: After plotting the graph, seems that data is still there in Device Object. If this is correct, then how should I free the memory allocated at the end of test so that fresh data is plotted; currently I am Clearing the screen using     ChartsCoordList_ClearList( &_this->CoordList ); at the end of test. Does it clears the memory allocated to DeviceObject?

Thanks in advance,

Vandana Matai
1 Answer

0 votes
by

Hi Vandana,

thank you for the provided explanations and observations - nevertheless, it is not still clear to me how your system initialization and your main loop are implemented.

First of all, I'm confused because the MemoryPool is not a member of the DisplayInfo structure. The DisplayInfo structure keeps the framebuffers, which can be allocated statically or (in your case) dynamically. The memory pool is the memory area that is given to the Embedded Wizard GUI application in order to manage the memory for the GUI application (Chora objects, graphical objects, strings, ...). This is provided typically as a static piece of memory, but it can be also allocated by an OS. In any case, the allocation of framebuffers and memory pools has to be done within the initialization of the system - in EwInit(). If you do that within EwProcess() - which represents the main loop of the GUI application - you will do further allocations with every call of EwProcess().

Can you check that and present your current implementation?

Furthermore, please make sure that the console outputs are working properly, then you can activate the monitoring of the RAM usage.

Concerning your second question: It is not clear to me, which memory you mean. If you are talking about Chora objects, then you do not have to care about freeing. All objects that are no more used are freed automatically by the GarbageCollection - for this purpose, the function EwReclaimMemory() of the Runtime Environment is called.

Let me know some more details about your tests.

Best regards,

Manfred.


by

Hello Manfred,

PFA stroked path Project and respective console log;  Project and Console1 with 200 edges, Console 2 with 250 edges. This time also graph gets disappeared.

I have involved: 

#define EW_PRINT_MEMORY_USAGE
// #define EW_DUMP_HEAP

#define EW_MAX_STRING_CACHE_SIZE      0x4000
#define EW_MAX_SURFACE_CACHE_SIZE   0x800000
#define EW_MAX_GLYPH_SURFACE_WIDTH       256
#define EW_MAX_GLYPH_SURFACE_HEIGHT      256
#define EW_MAX_NO_OF_GLYPHS                0
#define EW_MAX_ISSUE_TASKS               100

#define EW_LAZY_LOAD_BITMAPS                              1
#define EW_LAZY_LOAD_BITMAPS_IF_ANIMATED_ONLY             1
#define EW_DISCARD_BITMAPS                                1
#define EW_DISCARD_BITMAPS_IF_ANIMATED_ONLY               1
#define EW_DISCARD_BITMAPS_IF_NOT_USED_IN_CURRENT_UPDATE  0
#define EW_DISCARD_BITMAPS_IF_NOT_USED_IN_RECENT_UPDATES  0
#define EW_CACHE_OFFSCREEN_SURFACES                       0

from ew_config.h

NOTE: This time I am not editing any Package or Generated Code files except EwBspClockTickIncrement() is called from our 1ms_tick() function.

Sorry for bothering again,

Vandana Matai

by
Hi Vandana,

as mentioned in one of the comments above, I do not believe that the using vector graphs will solve the issue. It was recommended to have good implementation from the beginning of your project.

Can you try to run one of the provided examples with endless animations (e.g. GraphicsAccelerator demo) on your hardware and run that for some hours? Just to ensure that - without any events or data from outside - the GUI application is running stable.

I assume that the issue is somehow related to the integration.

Let me know the outcome.

Best regards,

Manfred.
by

Hello EW Team,

Appreciate the support so far. We had many trials of EW for our devices and probably go ahead with the licensing process soon.

In regard to the above query, I have disabled existing screen and enabled only EW GUI on our device with Graphic Accelerator Project files. This time also log report is same. Screen stops after some seconds; minimum time being 16 secs and maximum being 20 s. Please find the attached link: Query_12.12.22 which as some videos 1,3 ,4 and respective numbered log files. File numbered with 1 has LOG with EwPrintProfilerStatistic( 1 ) with Error 13 , numbered 3 has both EwPrintProfilerStatistic( 1 ) and EwDumpHeap( 1 ); numbered 4 has neither Statistic nor DumpHeap. 

Regards

Vandana Matai

by

Hello Vandana,

great to hear that you have now used the Graphics Accelerator demo to check the system stability. Thanks for providing the logs. Especially the Log3 is very helpful.

As you can see, the memory statistic is more or less stable - so the application should run for ever.

However, the heap dump indicates, that the memory is consumed and consumed until there is no memory left and the system stops. There was never a memory block freed. The counter FreeCounter is always 0.

One of the following situations could cause this issue:

  • There happens some memory allocation in some other thread by using EwAlloc().
  • The main loop does not contain the necessary function call EwReclaimMemory() to start the garbage collection.
  • The function EwFree() within the file ewextrte.c was modified and does not call the corresponding heap manager function.
 
Can you please check the above points and let me know the results? Can you post your current EwAlloc() and EwFree() implementation?
Thanks and best regards,
Manfred.


by
Hello Manfred,

Great catch!

EwFree() within the ewextrte.c was not calling EwFreeHeapBlock(). The EW project files are working with our firmware application and executing for hours now.

Thank you so much for the endless support.

Best Regards,

Vandana Matai

Ask Embedded Wizard

Welcome to the question and answer site for Embedded Wizard users and UI developers.

Ask your question and receive answers from the Embedded Wizard support team or from other members of the community!

Embedded Wizard Website | Privacy Policy | Imprint

...