Hi Team,
I went through the examples and found I can go with PulseOximeter example to achieve our custom design. Below is the created graph component.
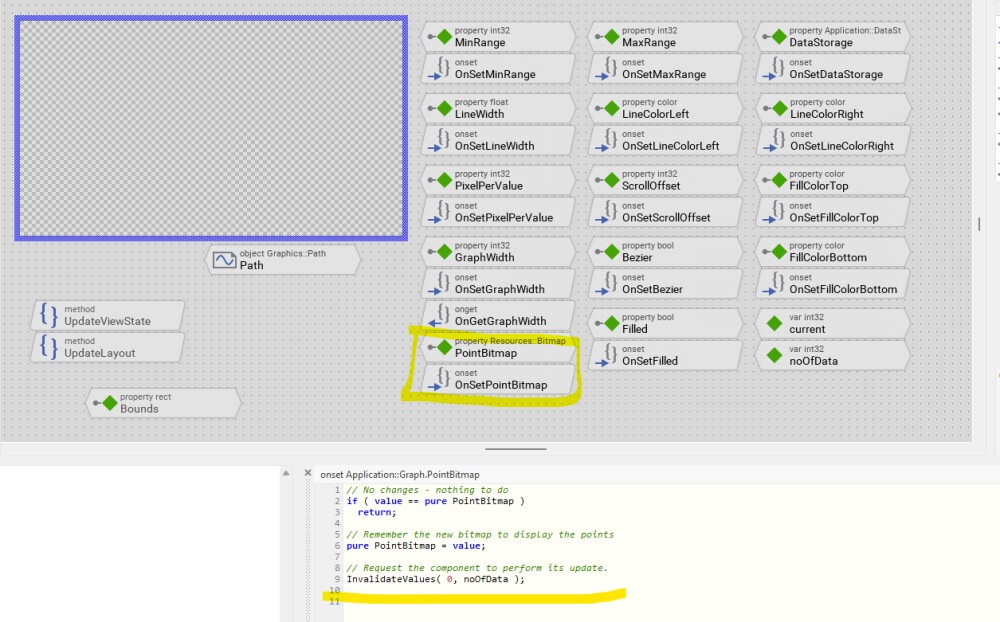
Here I have added a property point bitmap to show the value as dot. But I have no idea how I can adapt this to draw the graph . Graph is drawn through this below code.
// Always invoke the inherited method.
super( aState );

/* check if there are any data to draw */
if (( noOfData < 2 ) || ( ScrollOffset < -Bounds.w ) || ( DataStorage == null ))
  return;

var int32 inx;
var int32 x;
var bool firstRun = true;
var int32 noOfEdges = PixelPerValue / 4 + 1;

/* search for index and horizontal position of the first coordinate that is left of the views origin */
inx = ( ScrollOffset + Bounds.w ) / PixelPerValue + 1;
x = ( ScrollOffset + Bounds.w ) % PixelPerValue - PixelPerValue;

/* clear the path */
Path.InitSubPath( 0, noOfEdges * inx + 4 );

  var float data;
  var float slope;
  var float lastData = 0.0;
  var float lastSlope = 0.0;
   var int32 dx = PixelPerValue / 2;

  var float ratio = 0.25;


/* iterate through all visible data entries of the data storage */
while (( x < Bounds.w + PixelPerValue ) && ( inx >= 0 ))
{
  if ( inx < noOfData )
  {
    data = DataStorage.GetData( current - inx );
    slope = DataStorage.GetSlope( current - inx );

    data = (float)StrokePath.Bounds.h * ( data - (float)MinRange ) / (float)( MaxRange - MinRange );

    if ( firstRun == true )
    {
      Path.Begin( 0, x - (int32)LineWidth, /*StrokePath.Bounds.h / 2 */ 0 );
      Path.AddLine( 0, x, data );
      firstRun = false;
    }
    else
    {
        Path.AddLine( 0, x, data );
    }

    lastSlope = slope;
    lastData = data;
  }
  x = x + PixelPerValue;
  inx = inx - 1;
}
Path.AddLine( 0, x + (int32)LineWidth, /* StrokePath.Bounds.h / 2 */ 0 );
How this code should be modified to display the point bitmap? Please help.
Regards,
Sazna.